(The graph above is interactive, pull the slider located above the column chart)
We have published a few articles on this blog about the stunning pile-up of lease expirations in GSA’s national lease inventory and the reasons that have contributed to it, including Freeze the Footprint, downsizing mandates, budget distress and the effects of partisan gridlock.
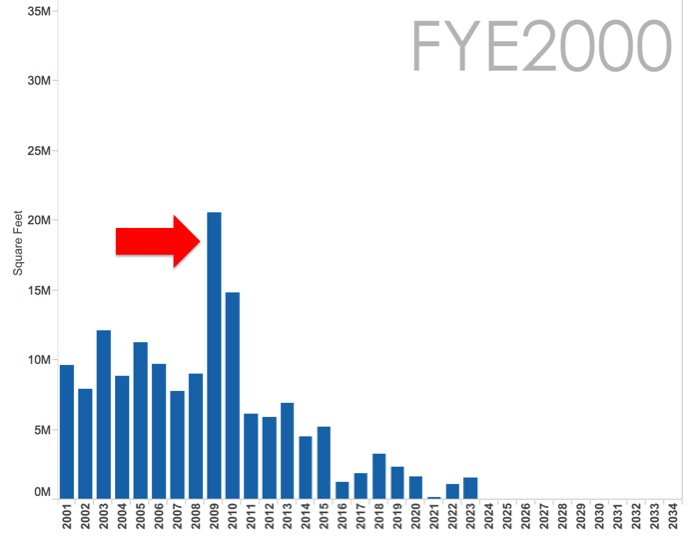
Yet, there is another really simple, if mysterious, reason for the dramatic pile-up of lease expirations: 2009. For some reason (and, so far, no one I’ve quizzed at GSA or elsewhere can recall exactly how or why this occurred) there has long been an unusually large volume of leases queued-up for expiration in the year 2009. This wasn’t apparent to us until we went back and looked at a table of GSA lease data we had received from the year 2000. From that vantage point, looking forward to the ensuing years, it was apparent that 2009 was going to be an unusually big year for expirations (see graph below for the lease expirations forecast as of FYE 2000).
To better understand how the year 2009 contributed to the pile-up, we put together a simple study in the interactive graph at the top of this article. We took lease expiration data from the end of each fiscal year from 2000 through 2014. Using each year’s data we created a column chart showing the lease expirations trend going forward from that year. If you move the slider all the way to the left, you will see that the level of lease expirations in 2009 stands tall, even from the perspective of FYE 2000. Advancing through the data sets (FYE 2001, FYE 2002, etc.) you begin to see the volume of lease expirations in 2009 increase, which is logical due to shorter-term leases and renewals executed in the intervening years that roll forward to 2009 expiration dates. As 2009 moves closer, the volume of lease expirations grows even larger due to kick-the-can extensions and holdovers (we call this effect the “Bow Wave”).
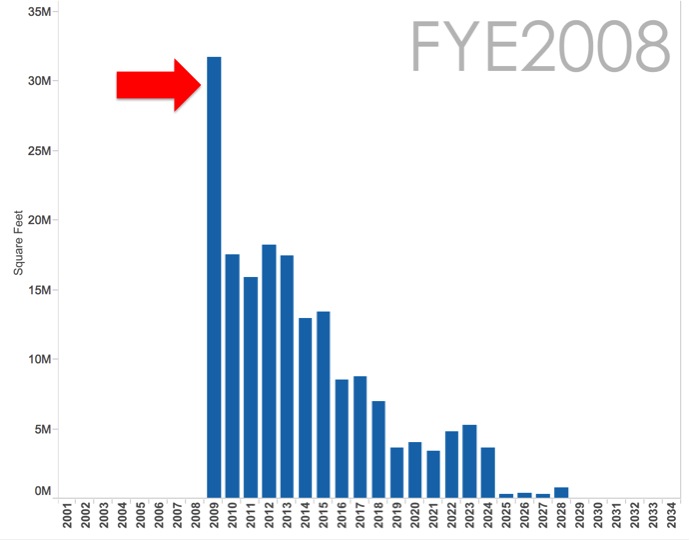
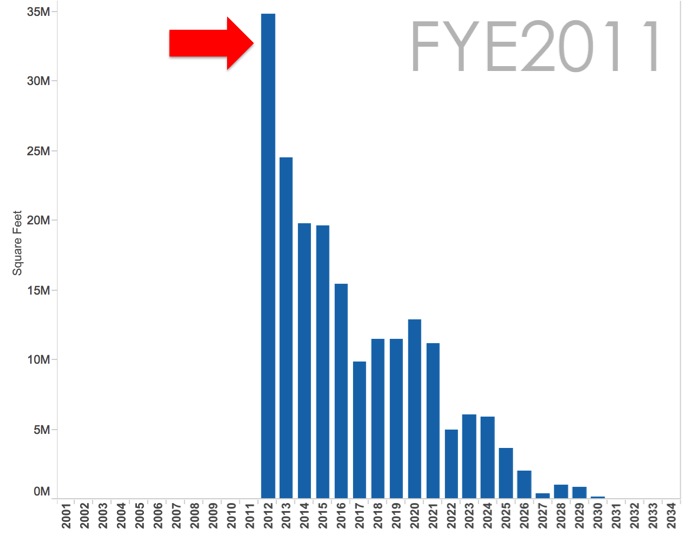
By the eve of 2009, more than 31 MSF of leases are scheduled to expire in that year–a towering wall of lease expirations. This volume was clearly beyond GSA’s capacity and so it is clear that an ever-greater volume of leases continued to roll forward on short term extensions (or holdovers), further exacerbating the trend in the years following 2009. Though the largest single-year expirations spike–34.8 MSF in 2012–has now been whittled down a bit, from where we sit today a breathtaking 100.3 MSF (half of GSA’s total inventory) is set to expire in the next five years.
SUMMARY
If the interactive at the top of this article doesn’t work for you, here are the highlights:
FYE 2000: From this vantage point, lease expirations slated for the fiscal year 2009 totaled 20.6 MSF, more than twice the average lease expirations for the years preceding it.
FYE 2008: By this point, lease expirations expected for 2009 had grown to 31.7 MSF due to renewals that occurred in prior years and also short-term extensions and holdovers.
FYE 2011: Because of GSA’s inability to keep up with the ever-growing leasing volume, expirations increased to their peak of 34.8 MSF in 2012.
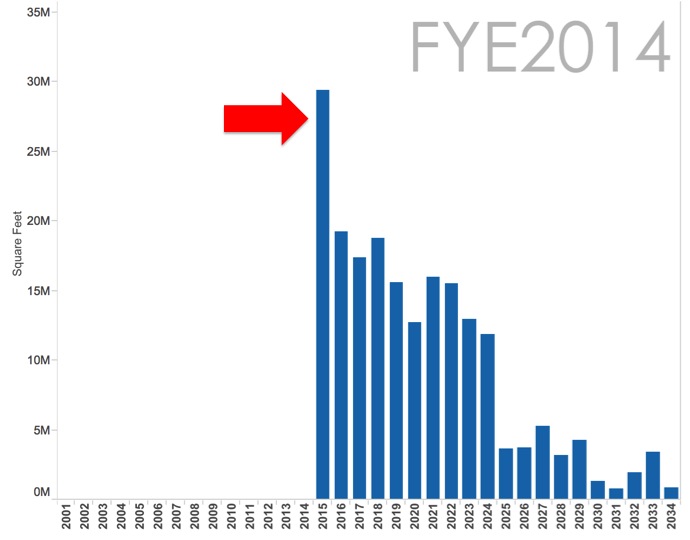
FYE 2014: Recent data demonstrates that GSA has whittled down some of the pile-up of near-term lease expirations, though one-quarter of the inventory is still due to expire in the next two years and one-half of the inventory will expire in the next five years.