While tracking sales of single-tenant GSA-leased properties over the last several years, we’ve noticed some interesting trends which won’t come as a surprise to experienced GSA investors, but may be of interest to new entrants to this specialized market.
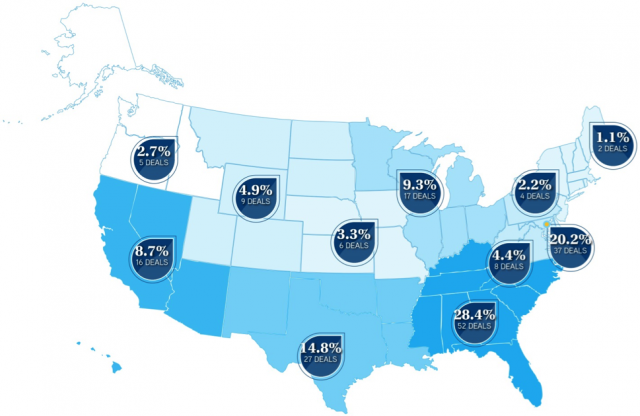
We catalogued a total of 183 transactions for the period 2011-13. The map below shows the regional distribution by number of deals. Region 4 (Southeast) had the most sales with 52 transactions during this period. Region 11 (National Capital Region) ranked second with 37 transactions and Region 7 (Southwest) followed in third place with 27 sales. Collectively, these three regions accounted for more than 63%. It’s no secret which regions have garnered the most attention from GSA investors.
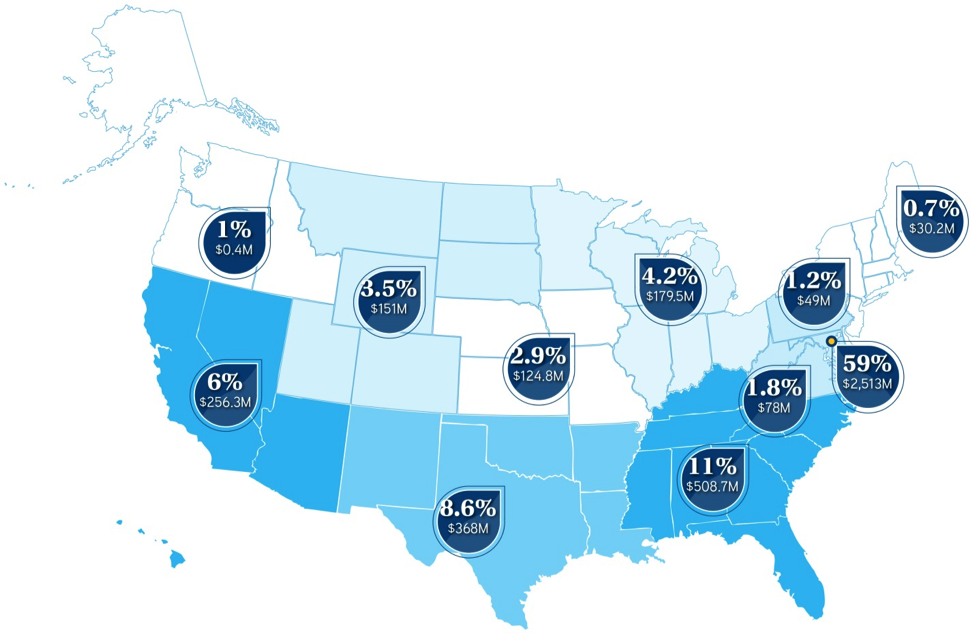
Those same 183 transactions resulted in a total sales volume of more than $4.26 billion for the period 2001-13. If we look below at the same map with sales distributed by transaction volume, not surprisingly the National Capital Region (NCR) dominated the market with the highest sales volume of GSA-leased product, completing over $2.5 billion in sales during this three year period. The Southeast Region had the next highest transaction volume with just over $508 million. Although the Southeast Region sold over 40% more properties than the NCR, the average sale in Region 11 was approximately seven times higher; $9.8 million vs. $67.9 million, respectively. With the continued slowdown in construction of new GSA facilities, it will certainly be interesting to see the impact on sales over the next three years.